Teaching range and domain to grade 10 learners is always a challenge. At this point, the only function they know is the straight line which has an infinite range and domain. Therefore, the concepts don’t really make sense to them. And starting a chapter by feeling lost does not bode well for the rest of functions.
This year I decided to use the Desmos graphing calculator to introduce the concept of line segments and limiting the range and domain. The original plan was to ask them to draw me a picture using only straight lines on Desmos (with no further instructions). But my learners are so used to being spoon-fed that giving them a blind exercise like that (and they have never used Desmos themselves) would unnerve them so much that they will not even try.
 So I created some scaffolding, by showing them The House of Graphs and asking them to copy it on their tablet. It took about 15 minutes for them to copy the equations. After about 10 minutes I hid the equations to force them to think about what they are doing and not just copy from the board.
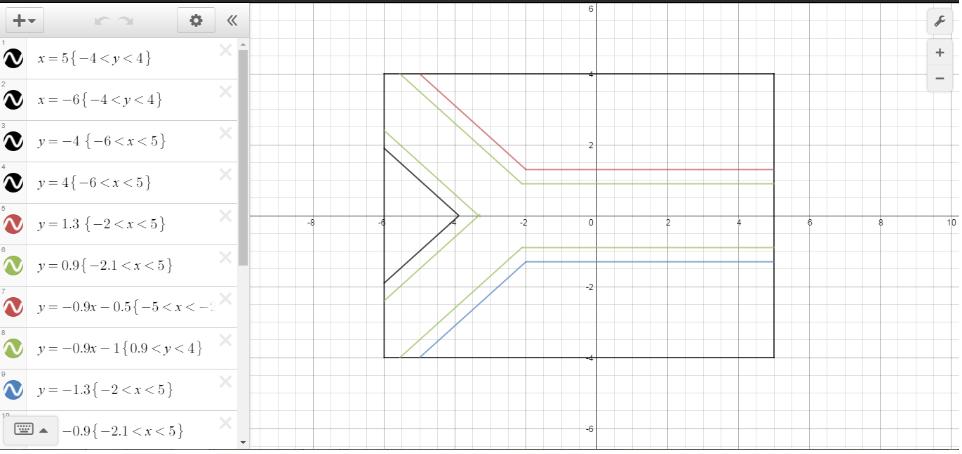 I then asked them to start on the real assignment, drawing the South African flag. I decided on the flag because it is an image they are all familiar with and it only consists of straight lines. It is also not overly complicated. Even so it took me just over 20 minutes to draw it and for most of them it would have taken closer to an hour.
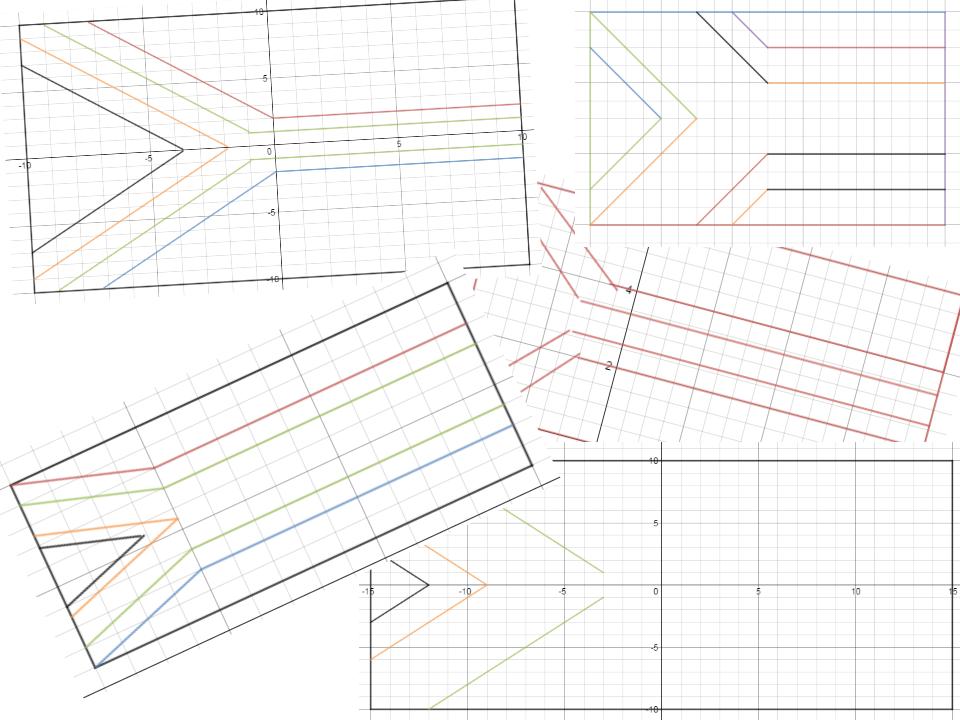
Lets face it. Not everybody could figure it out completely (and not everybody have an eye for drawing even if it is with graphs) But everybody learned something. And some even did a better job than I did.
You might ask yourself if drawing a picture with graphs serves any purpose. On its own it doesn’t, but when I explained the concept of range and domain in the next lesson, they were not staring at me with confused expressions. We could link the new terminology to something concrete.
My colleague asked me if I am not doing it the wrong way round, should I not teach them how to limit a line segment before I ask them to do it. Changing the order of the lessons around it one of the big mind shifts I had to make. I no longer assume that learners can not do something unless I have taught it to them. I give them a problem they have not come across before and might or might not be able to solve and then spend the lesson answering their questions about it. Unlike before where I would spend my lesson answering questions that they haven’t even thought to ask yet.
Some practical tips:
- I had them work two-two together on the House of Graphs. It makes everything go a bit quicker; they are not so intimidated by a new programme if they can do it together and they can help each other.
- They handed the completed flag in via Google Classroom. One or two had issues to hand-in a link, so they just took a screenshot of the final product and handed that in.
- In the previous lesson, we revised straight lines a bit.
A special surprise
.@butterfly_class Nice blog post. Here is an example of your lesson using the Desmos Activity Builder. https://t.co/CUBDWlmqA4— Desmos.com (@Desmos) May 16, 2016
Leave a Reply